One of the more eye-catching things to come out of the Budget last week was the Chancellor’s pledge for 300,000 new homes per year in England. Given that according to the DCLG’s quarterly statistics on new house building we built just over 140,000 homes in 2016, can it be possible to more than double house building activity in the next five years?
On this basis, it seems like a firm ‘no’, but the government is not just talking about new build. It wants to raise overall housing supply, defined as net additional dwellings.
This is described by government as “the primary and most comprehensive measure of housing supply”, which comprises a lagged and more comprehensive measure of new house building sourced from local authority data returns rather than the building control inspection data used in DCLG’s quarterly leading indicator.
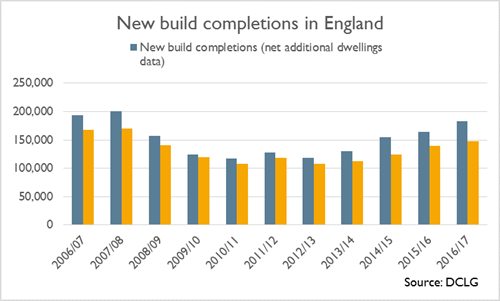
For 2016/17, this inclusion of late data and completions that most likely are not covered by NHBC building control inspectors increased the new build component by 24.1% – to 183,570 compared to the 147,920 annual total in the quarterly data.
The net additions measurement of housing supply also includes change of use (converting office, agricultural, retail or storage buildings to residential) and conversions (converting a house into multiple flats, for example).
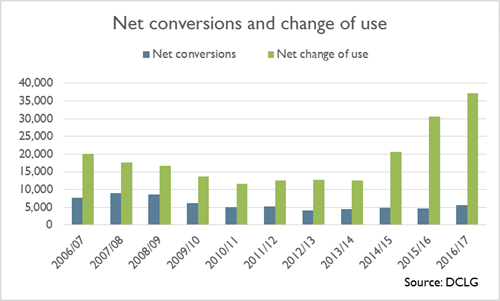
In 2016/17, net conversions added 5,680 dwellings and net change of use added 37,190. As the chart below shows, the net change of use element has risen sharply over the last four years, largely due to permitted development rights introduced in 2013 that loosened the planning process for office to residential conversions. This meant change of use accounted for 17.1% of total net housing supply in 2016/17, compared to 7.9% in 2007/08, the last time net supply exceeded 200,000.
Furthermore, dwellings completed through change of use were a clear contributor to housing supply in cities last year: Bristol (52.1% of net supply), Sheffield (29.5%), Liverpool (26.2%), Birmingham (26.1%) and London (22.1%). Notably, however, change of use through permitted development rights means affordable housing requirements, Section 106 contributions and Community Infrastructure Levy receipts are severely reduced.
In total, when demolitions are subtracted, net supply of housing was 217,350 in 2016/17, which significantly raises the starting point for achieving the government’s ambition to reach 300,000.
With annual growth of 5%, this can be reached by 2023/24. And given that annual growth in net housing supply has averaged 15% over the last four years, it definitely appears less challenging than at first glance. Add in the other slow-burning housing announcements made in the Budget and it could even be achieved by the end of this parliament.